PMT and Electronics Setup
Hardware Setup[edit | edit source]
This experiment seeks to measure ionizing radiation by reading the electrical outputs of a 4 channel scintillator using an oscilloscope.
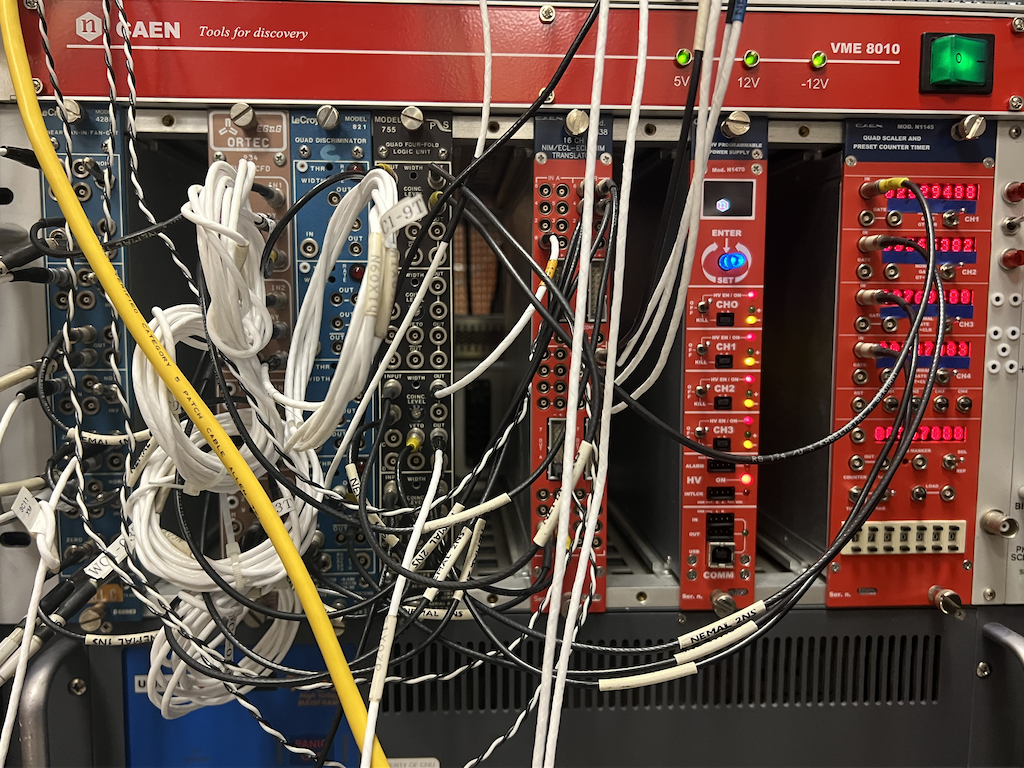
Hardware consists of:
- Linear Fan In/Fan Out
- Quad CFD
- Quad Discriminator
- Quad Four Fold Logic Unit
- NIM/ECL - ECL/NIM Translator
- CAEN 4-channel Programmable Power Supply.
- Quad Scaler and Present Counter timer

It is worth noting that if the scintillator has gaps or holes in the scintillator covering, this will result in a light leak. This will cause an uptick in dark current in readouts, and will skew data significantly.
Attaching Cables
Each PMT has a connector labeled (HV) for high voltage. The user must securely fasten the (HV) cables, which can then be connected to the PMTs and linked to the power supply through separate channels (Channels 0 to 3).
Polarity
Additionally, the user must verify that the polarity on the power supply is set to negative. If it is not, the polarity can be adjusted by removing the power supply, removing the rear panel, and switching the polarity. For further instructions, please refer to the power supply manual.
Gain Matching[edit | edit source]
The power supply used in this project is the CAEN 4-channel Programmable Power Supply. The user should be aware that Channel 0 corresponds to Tube 1, Channel 1 to Tube 2, Channel 2 to Tube 3, and Channel 3 to Tube 4. To operate the power supply, the user must first select the desired channel. After selecting the channel, the user should turn the knob until the "VSET" option is displayed. Once "VSET" is selected, the voltage must be set to at least 1200V, as anything lower will cause the output to drop below the threshold.
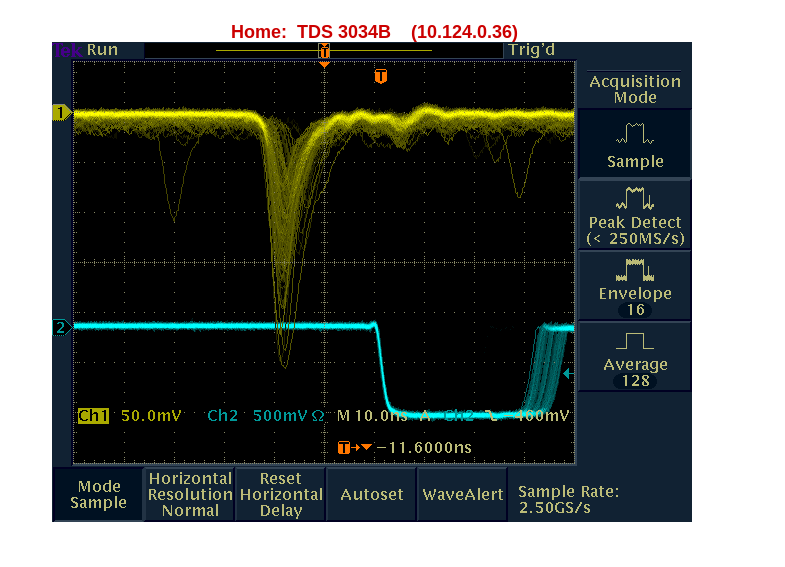
The oscilloscope will display the PMT output for each tube. The user must set a trigger value on the oscilloscope. Once the trigger is set, it must not be changed, as altering it will invalidate all previously recorded measurements. Next, turn the dial labeled "Scale" until the PMT output is large enough to easily observe the mV value (for most of these, we used 200 mV). Record the mV value by measuring the wavelength using the tick marks on the monitor. For example, referring to Figure 2 below, the resulting PMT output is 2500 mV based on the tick marks.


This is determined by counting from the crest to the trough of the waveform. After that, continue increasing the voltage in increments of 100V. Create a graph to plot the voltages as shown in Figure 3 above. The voltage (V) should be recorded on the x-axis, and the output voltage (mV) should be plotted on the y-axis. Continue this process until the input voltage reaches 2600V. The slope of the graph should begin to plateau at higher voltages (we observed this plateau between 800V and 1800V). Repeat this process for tubes 1, 2, and 3.
Oscilloscope Trigger[edit | edit source]
An Oscilloscope Trigger is a function that allows the user to start the oscilloscope measurements at a specific point in time. The modes include
- Auto: Continuously updates screen, even if no valid trigger
- Normal: Updates only if valid trigger condition is met
- Single: Captures a singular waveform when trigger condition occurs Trigger is activated manually. Useful for capturing a single trigger event.
Trigger level is voltage at which rising edge or other trigger condition is met. Slope determines whether the oscilloscope triggers on the rising edge or falling edge
Discriminator Setup[edit | edit source]

- Leading Edge vs Constant Fraction Discriminators
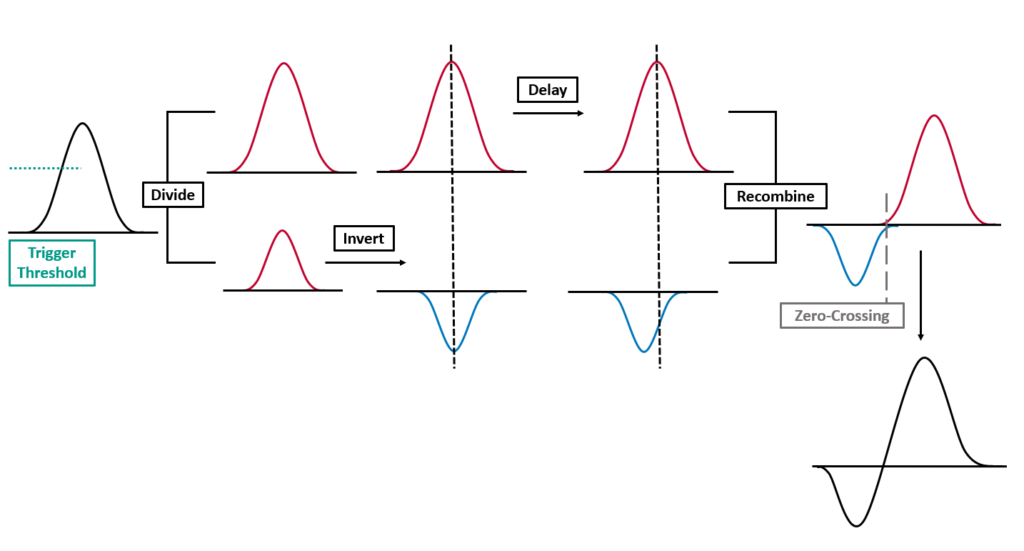
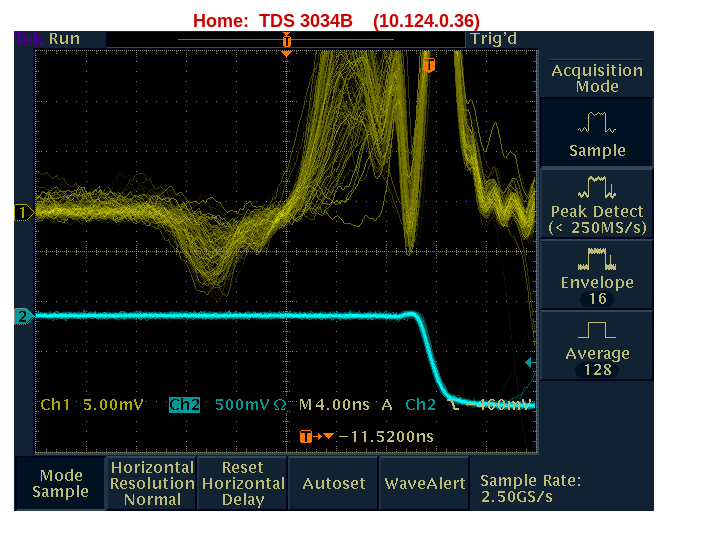
A Constant Fraction Discriminator (CFD) ensures accurate timing even in the presence of pulse fluctuations and system noise. The leading edge of a pulse, when used for logic pulse generation, can introduce delays. The Constant Fraction Discriminator addresses this issue by dividing the incoming pulse into two parts: 2/3 and 1/3. The lower portion is inverted, and the higher portion is delayed. These two parts are then recombined, with the zero-crossing point now occurring at the recombination point of the two signals. This method minimizes delays by making the zero-crossing point independent of the signal amplitude. In this experiment, a Constant Fraction Discriminator is used, and the delay is determined by the cables employed. Specifically, the white cables used in this setup introduce a delay of 8 nanoseconds.
- Connect the current from the current tube to Channel 1 on the oscilloscope.
- Use the appropriate cable to connect the current from the tube to the discriminator. For this experiment, a white cable with a delay of 8 nanoseconds is used.
- Run a cable from the output of the discriminator to Channel 2 on the oscilloscope.
- This setup should display both a waveform and a logic pulse on the oscilloscope screen.
- Repeat the process for the remaining tubes to ensure they are all functioning correctly.

Setting Threshold[edit | edit source]
1. Determining Threshold To determine the appropriate threshold, the user should adjust the oscilloscope's trigger level so that it is just a few millivolts above the dark current. The threshold should be set high enough to avoid constant triggering from the dark current, but low enough to capture actual events.
2. Setting Threshold In order to set the threshold a voltmeter and a screwdriver must be used. The positive probe of the voltmeter must be placed in the hole to the left of the T. Ground the other probe on the screw . Lastly insert the screwdriver into the hole to the right of T(orange). Turn the screw until the voltmeter reaches approximately 30mV.
Trigger Timing[edit | edit source]
The Luter 345 Cosmic Ray Detector is a scintillation detector that is used to detect cosmic rays. The detector comprises two parallel scintillator paddles, each with two PMTs (one at each end of light guides that collect scintillation light from the left and right end of the scintillating material).
Consider a cosmic ray that strikes the top scintillator paddle at position, at . The cosmic ray then passes through the top scintillator paddle and strikes the bottom scintillator paddle at position, at time, . The times of the signals generated by each PMT are given by:
where is the width of the scintillator paddle, is the speed of light in the scintillator, , , , and are the transit times of the scintillation light in the light guides, and is the time of flight of the cosmic ray between the top and bottom scintillator paddles.
We assume that the trigger time for a given event carries the timing of the bottom left signal, i.e. .
The TDC unit in the experiment is operated in common stop mode, where the trigger time is the common stop signal for all four PMTs. The TDC times recorded for each PMT are given by:
Substituting the expressions for , , , , and into the expressions for , , , and , we get:
If we now look at the time difference between left and right TDC times for the top and bottom scintillator paddles, we get:
from which we can calculate the top and bottom positions of the cosmic ray as:
The conclusion, then, is that we can look at plots of:
These should show a linear dependence, .
Looking at the time sums for the top and bottom scintillator paddles, we get:
Finally, we can calculate the overall mean time of flight of the cosmic ray as:
If the tube times are the same for all tubes, this should just be equal to the time-of-flight (which may or may not be the case). But, if we look at this quantity as a function of the angle of the cosmic ray, we should see a correlation between the angle and the time of flight.