Results & Outlook: Difference between revisions
Appearance
en>Ryan No edit summary |
m 1 revision imported |
(No difference)
| |
Latest revision as of 17:59, 24 December 2024
Results[edit | edit source]
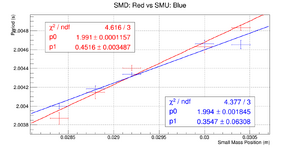
Plotting the collected data results in the graph shown. It indicates that the period where the small mass up (SMU) and small mass down (SMD) coincide is ...
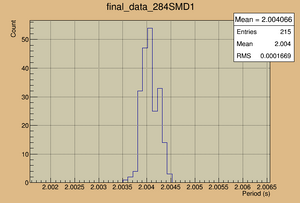
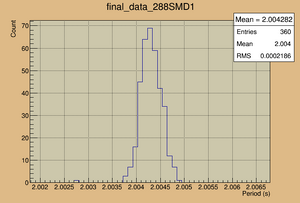
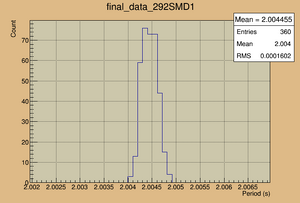
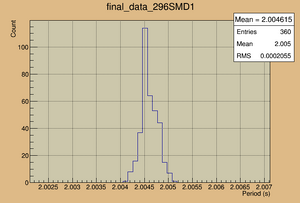
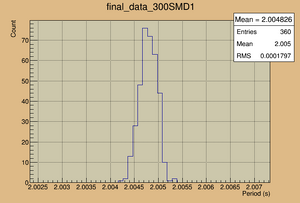
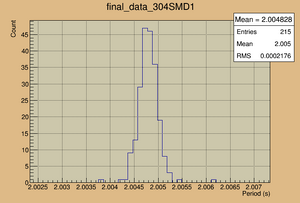
Histograms of Data taken at Various Small Mass Positions in the SMD Orientation.
 |
 |
 |
 |
 |
 |
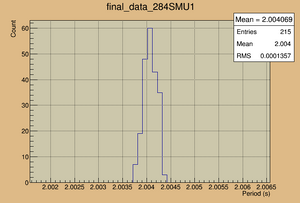
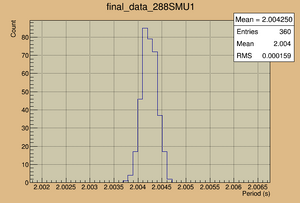
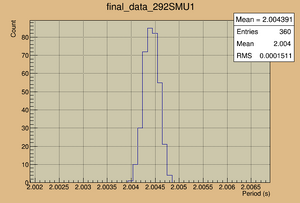
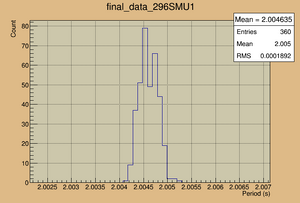
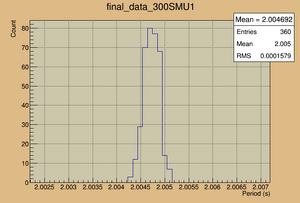
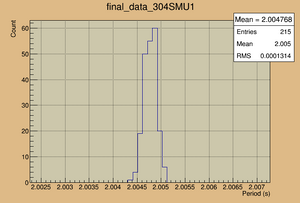
Histograms of Data taken at Various Small Mass Positions in the SMU Orientation.
 |
 |
 |
 |
 |
 |
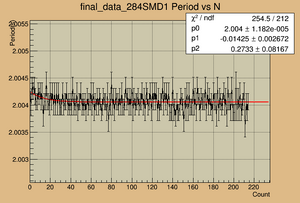
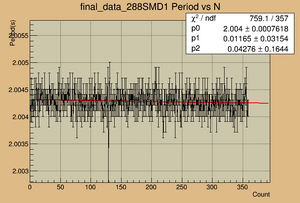
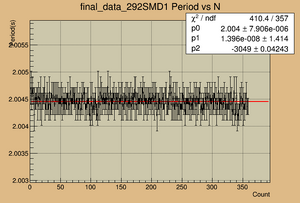
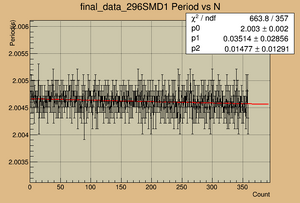
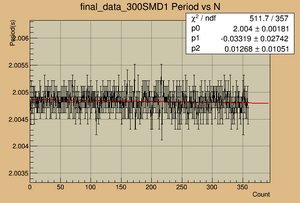
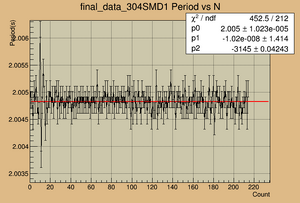
Plots of Period vs Count taken at Various Small Mass Positions in the Small Mass Down (SMD) Orientation.
 |
 |
 |
 |
 |
 |
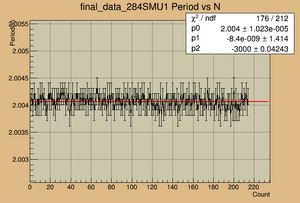
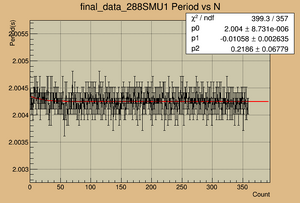
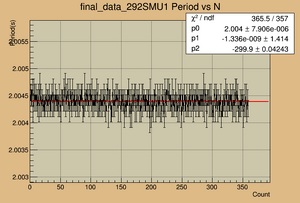
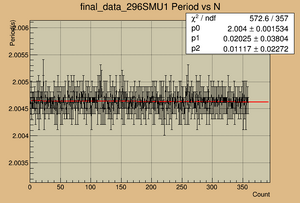
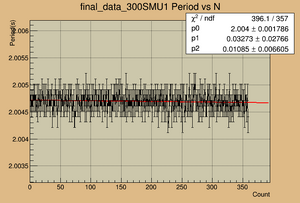
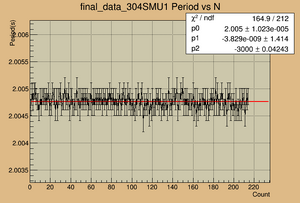
Plots of Period vs Count taken at Various Small Mass Positions in the Small Mass Up (SMU) Orientation.
 |
 |
 |
 |
 |
 |