Data
Length and Mass Measurements
Measurements of the mass and length were made for the wire and the weight. As discussed in the Theory section, these measurements were used to computed the total length from the pivot point to the adjusted center of mass of the system.
| Mass | Length | |
|---|---|---|
| Wire | 11.28g | 10.754m |
| Weight | 769.30g | 0.198m |
| Total | 780.58 | 10.871m |
Timing Data Collection
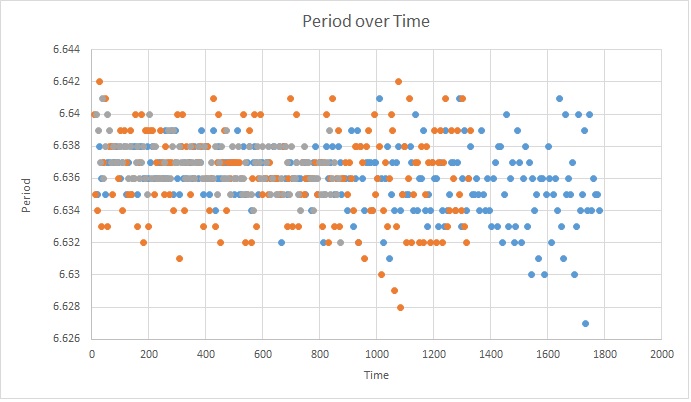
The photogate recorded timing information for each oscillation. Three runs of 268, 201, and 131 oscillations respectively were recorded. The raw data from each run can be seen in the attached Excel spreadsheets below.
The average and standard deviation for the period of oscillation was computed for each run independently, and for the entire data set, as seen in the table below.
| T avg | STDEV | |
|---|---|---|
| Run1 | 6.6368s | 0.002056 |
| Run2 | 6.6362s | 0.002627 |
| Run3 | 6.6367s | 0.00137 |
| Total | 6.6362 | 0.00216 |
The period of each oscillation was plotted and fitted as a function of time for each run. As expected, the period appears relatively constant between runs and drops off slowly over time as energy is dissipated from the system.

